
Building a Home Assistant Custom Component Part 5: Debugging
This is the fifth and final part of a multi-part tutorial to create a Home Assistant custom component.
- Part 1 - Project Structure and Basics
- Part 2 - Unit Testing and Continuous Integration
- Part 3 - Config Flow
- Part 4 - Options Flow
- Part 5 - Debugging (Reading Now!)
Introduction
This is the final part of the tutorial for creating a Home Assistant custom component. This post will cover how to debug your custom component to ensure it works as expected and to figure out why some thing might not be working like you expect.
I must admit, I only recently learned about the devcontainer offered by Home Assistant for local development. Prior to learning about it, I would modify files locally, scp them to the the correct folder on my Home Assistant instance then restart my instance. Not only was this slow, but it also meant my Home Assistant instance powering my house would have to go down constantly as I tried out changes when debugging a problem. As it turns out, Home Assistant had already developed a solution for local development that doesn’t require taking down your “production” instance. Enter the devcontainer.
Visual Studio Code + devcontainer
To utilize the devcontainer, you will first need to install Visual Studio Code. Visual Studio Code is a free IDE that is extremely popular and has plenty of extensions for speeding up and improving development. After installing there are a few other requirements that must be installed, check out the official documentation for more details.
After you have installed the prerequisites and cloned the home-assistant/core repository, you can start Visual Studio Code and open the cloned directory. When opening the folder for the first time, Visual Studio Code will detect the devcontainer and ask if you would like to open the editor in the container, select yes. This first open will build the container which may take a minute or two. Subsequent opens will be much quicker as it will reuse the built container.
Configuring the devcontainer
Before we proceed further we will need to copy our custom component into the config
directory in the root of the cloned home-assistant/core repository. Note that you may
need to elevate your permissions as docker will create files owned by root in the config
directory. Alternatively you can use the built-in terminal in the IDE which gives you a
root prompt with the correct permissions.
First navigate to /path/to/cloned/home-assistant/config and create a custom_components
directory. From there copy your custom component directly into this new folder. For our
tutourial project we’d copy the entire github_custom directory.
Next add any necessary configuration to the configuration.yaml file. Since our tutorial
custom component uses the config flow, we don’t need to add anything as we can add the
integration and set it up in the configuration UI.
Run Home Assistant
Now that we have our files copied and configuration updated, return to Visual Studio Code
and click on the Run tab (Ctrl+Shift+D) in the left panel. You will see a mostly empty
panel with a dropdown at the top that contains debug configurations that can be run.
At the time of writing there are 2 options, Home Assistant which runs a local instance and
Preview (nodejs) which runs a local instance of the documentation site.
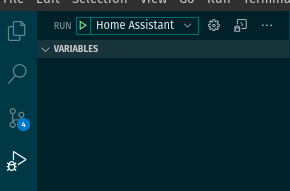
Select Home Assistant from the dropdown and click the green triangle to start the
debugger. This will also open the Terminal panel at the bottom where you can
see the Home Assistant logs. You can now navigate to http://localhost:8123
in your browser and you will be guided through the initial setup of Home Assistant (creating
your user, etc.). In Visual Studio Code you will also see a debug toolbar pop up near the
top center of the IDE.
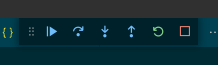
The debug toolbar contains controls for the following operations in the order the icons appear to the right:
- Pause/Resume
- Step over
- Step into
- Step Out
- Restart
- Stop
Check out the Visual Studio Code documentation for more details on what each operation does. The most used buttons will be to resume the program after hitting a breakpoint and restarting Home Assistant after making python code changes.
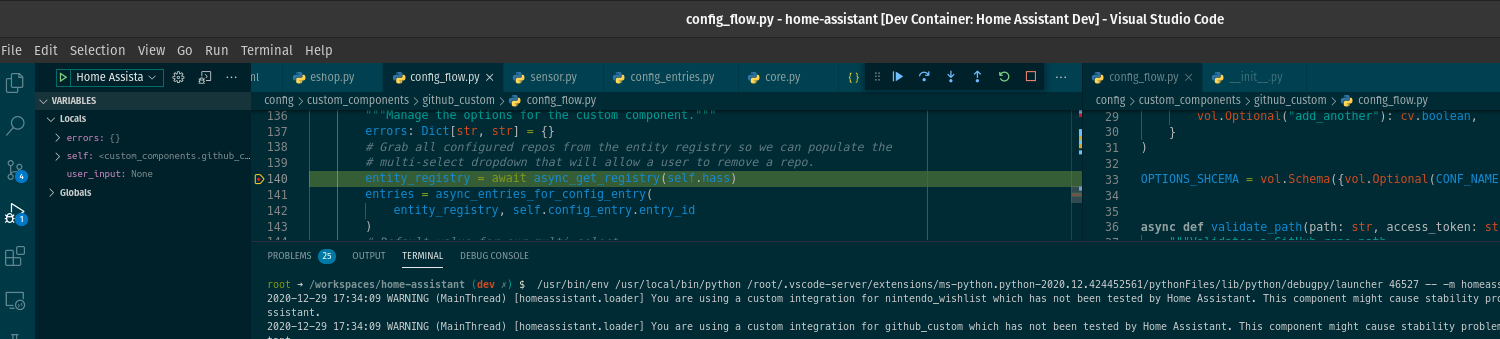
Breakpoints
Breakpoints are extremely useful for being able to stop program execution and inspect variables at a particular spot in your code. To set a breakpoint find the line where you want to pause the program flow and inspect the variables and click to the left of the line number. This will add a red dot which indicates a break point. When you hit that code while navigating Home Assistant in your browser, it will automatically pause the program and allow you to inspect values in the run panel.
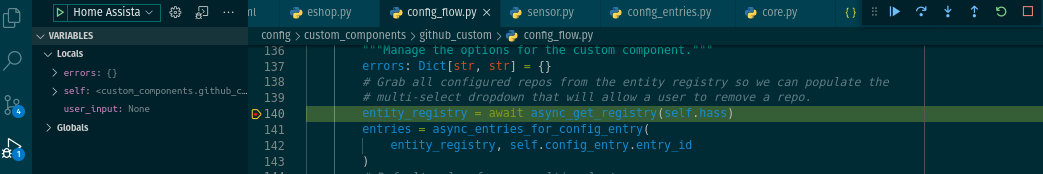
In the screenshot above you can see the local and global variables along with their values. After you are done inspecting the values you can click the resume button in the debug toolbar to continue program execution until it hits another breakpoint.
Wrap Up
As you can see the devcontainer inside Visual Studio Code makes debugging your custom component much simpler and faster.
I sincererly hope that these posts have helped you understand how you can develop your own custom component (and possibly even add it to Home Assistant at some point in the future). Many of the concepts documented in these posts also apply to the official Home Assistant code base, so I highly encourage you to contribute or become a code owner of an existing integration.